
pdf pdf |
|---|
YAML Metadata Warning:empty or missing yaml metadata in repo card
Check out the documentation for more information.
HeatCast: A Benchmark for Neighborhood-Scale LST Forecasting across 124 U.S. Cities
![]()
![]()
![]()
GitHub • HuggingFace Dataset • Visualization
SIGSPATIAL 2026 Benchmarks Track Submission
A large-scale open-source benchmark dataset for forecasting monthly Land Surface Temperature (LST) at 30 m spatial resolution across 124 U.S. cities, with Earthformer and CNN+LSTM baselines and an interactive web application.
Overview
Land Surface Temperature (LST) serves as a critical indicator for quantifying urban heat islands and informing climate-resilient urban planning, particularly for vulnerable communities. However, the lack of open-source, large-scale, spatio-temporal datasets poses significant challenges to research at the national scale across the United States.
This repository presents:
- A benchmark dataset spanning 124 U.S. cities from 2013 to June 2025 (~1.4 million 128×128 tiles at 30 m resolution)
- Earthformer and CNN+LSTM baselines with reproducible training pipelines
- An interactive web application for visualizing LST predictions over San Antonio, TX
Key Contributions
- Cross-city forecasting: 124 cities spanning diverse climates, enabling models that generalize beyond single-city training
- Neighborhood-scale resolution: 30 m spatial resolution, sufficient to distinguish thermal differences between adjacent blocks
- Reproducible baselines: Open code, data, and model weights; Earthformer reaches 7.74 K aggregate RMSE, a ~26% improvement over CNN+LSTM (10.42 K)
- LST Web Application: Integrates LST predictions into mapping software through an LLM interface for planning guidance
Dataset
Download
The dataset is available on HuggingFace: JesseGuerreroML/HeatCast. Each city is a self-describing Zarr v3 store that streams directly over HTTP.
huggingface-cli download JesseGuerreroML/HeatCast --repo-type dataset --local-dir ./Data/HeatCast
Data Components
| Feature | Description | Resolution |
|---|---|---|
| LST | Land Surface Temperature | 30 m, Monthly |
| NDVI | Normalized Difference Vegetation Index | 30 m, Monthly |
| NDWI | Normalized Difference Water Index | 30 m, Monthly |
| NDBI | Normalized Difference Built-up Index | 30 m, Monthly |
| Albedo | Liang broadband albedo | 30 m, Monthly |
| RGB | Red, Green, Blue channels | 30 m, Monthly |
| DEM | Digital Elevation Model (NASADEM) | 30 m, Static |
| LCZ | Local Climate Zones (CONUS-wide) | 100 m, Annual |
Dataset Statistics
| Attribute | Value |
|---|---|
| Cities | 124 (CONUS) |
| Temporal Coverage | 2013 – Jun 2025 |
| Temporal Cadence | Monthly |
| Spatial Resolution | 30 m |
| Tile Size | 128 × 128 pixels (3.84 km on a side, ~14.75 km²) |
| Input Channels | 9 (LST, DEM, R, G, B, NDVI, NDWI, NDBI, Albedo) |
| Output Channel | 1 (LST) |
| Input Sequence Length | 12 months |
| Output Sequence Length | 1 month |
| Total Tiles | ~1.4 million |
| Storage Size | ~150 GB |
Temporal Splits
| Split | Period | Months |
|---|---|---|
| Training | Jan 2013 – Dec 2021 | 108 |
| Validation | Jan 2022 – Dec 2023 | 24 |
| Testing | Jan 2024 – Jun 2025 | 18 |
All 124 cities appear in every split, measuring forecasting ability under temporal distribution shift. The split is frozen and distributed with the release.
The Forecasting Signal
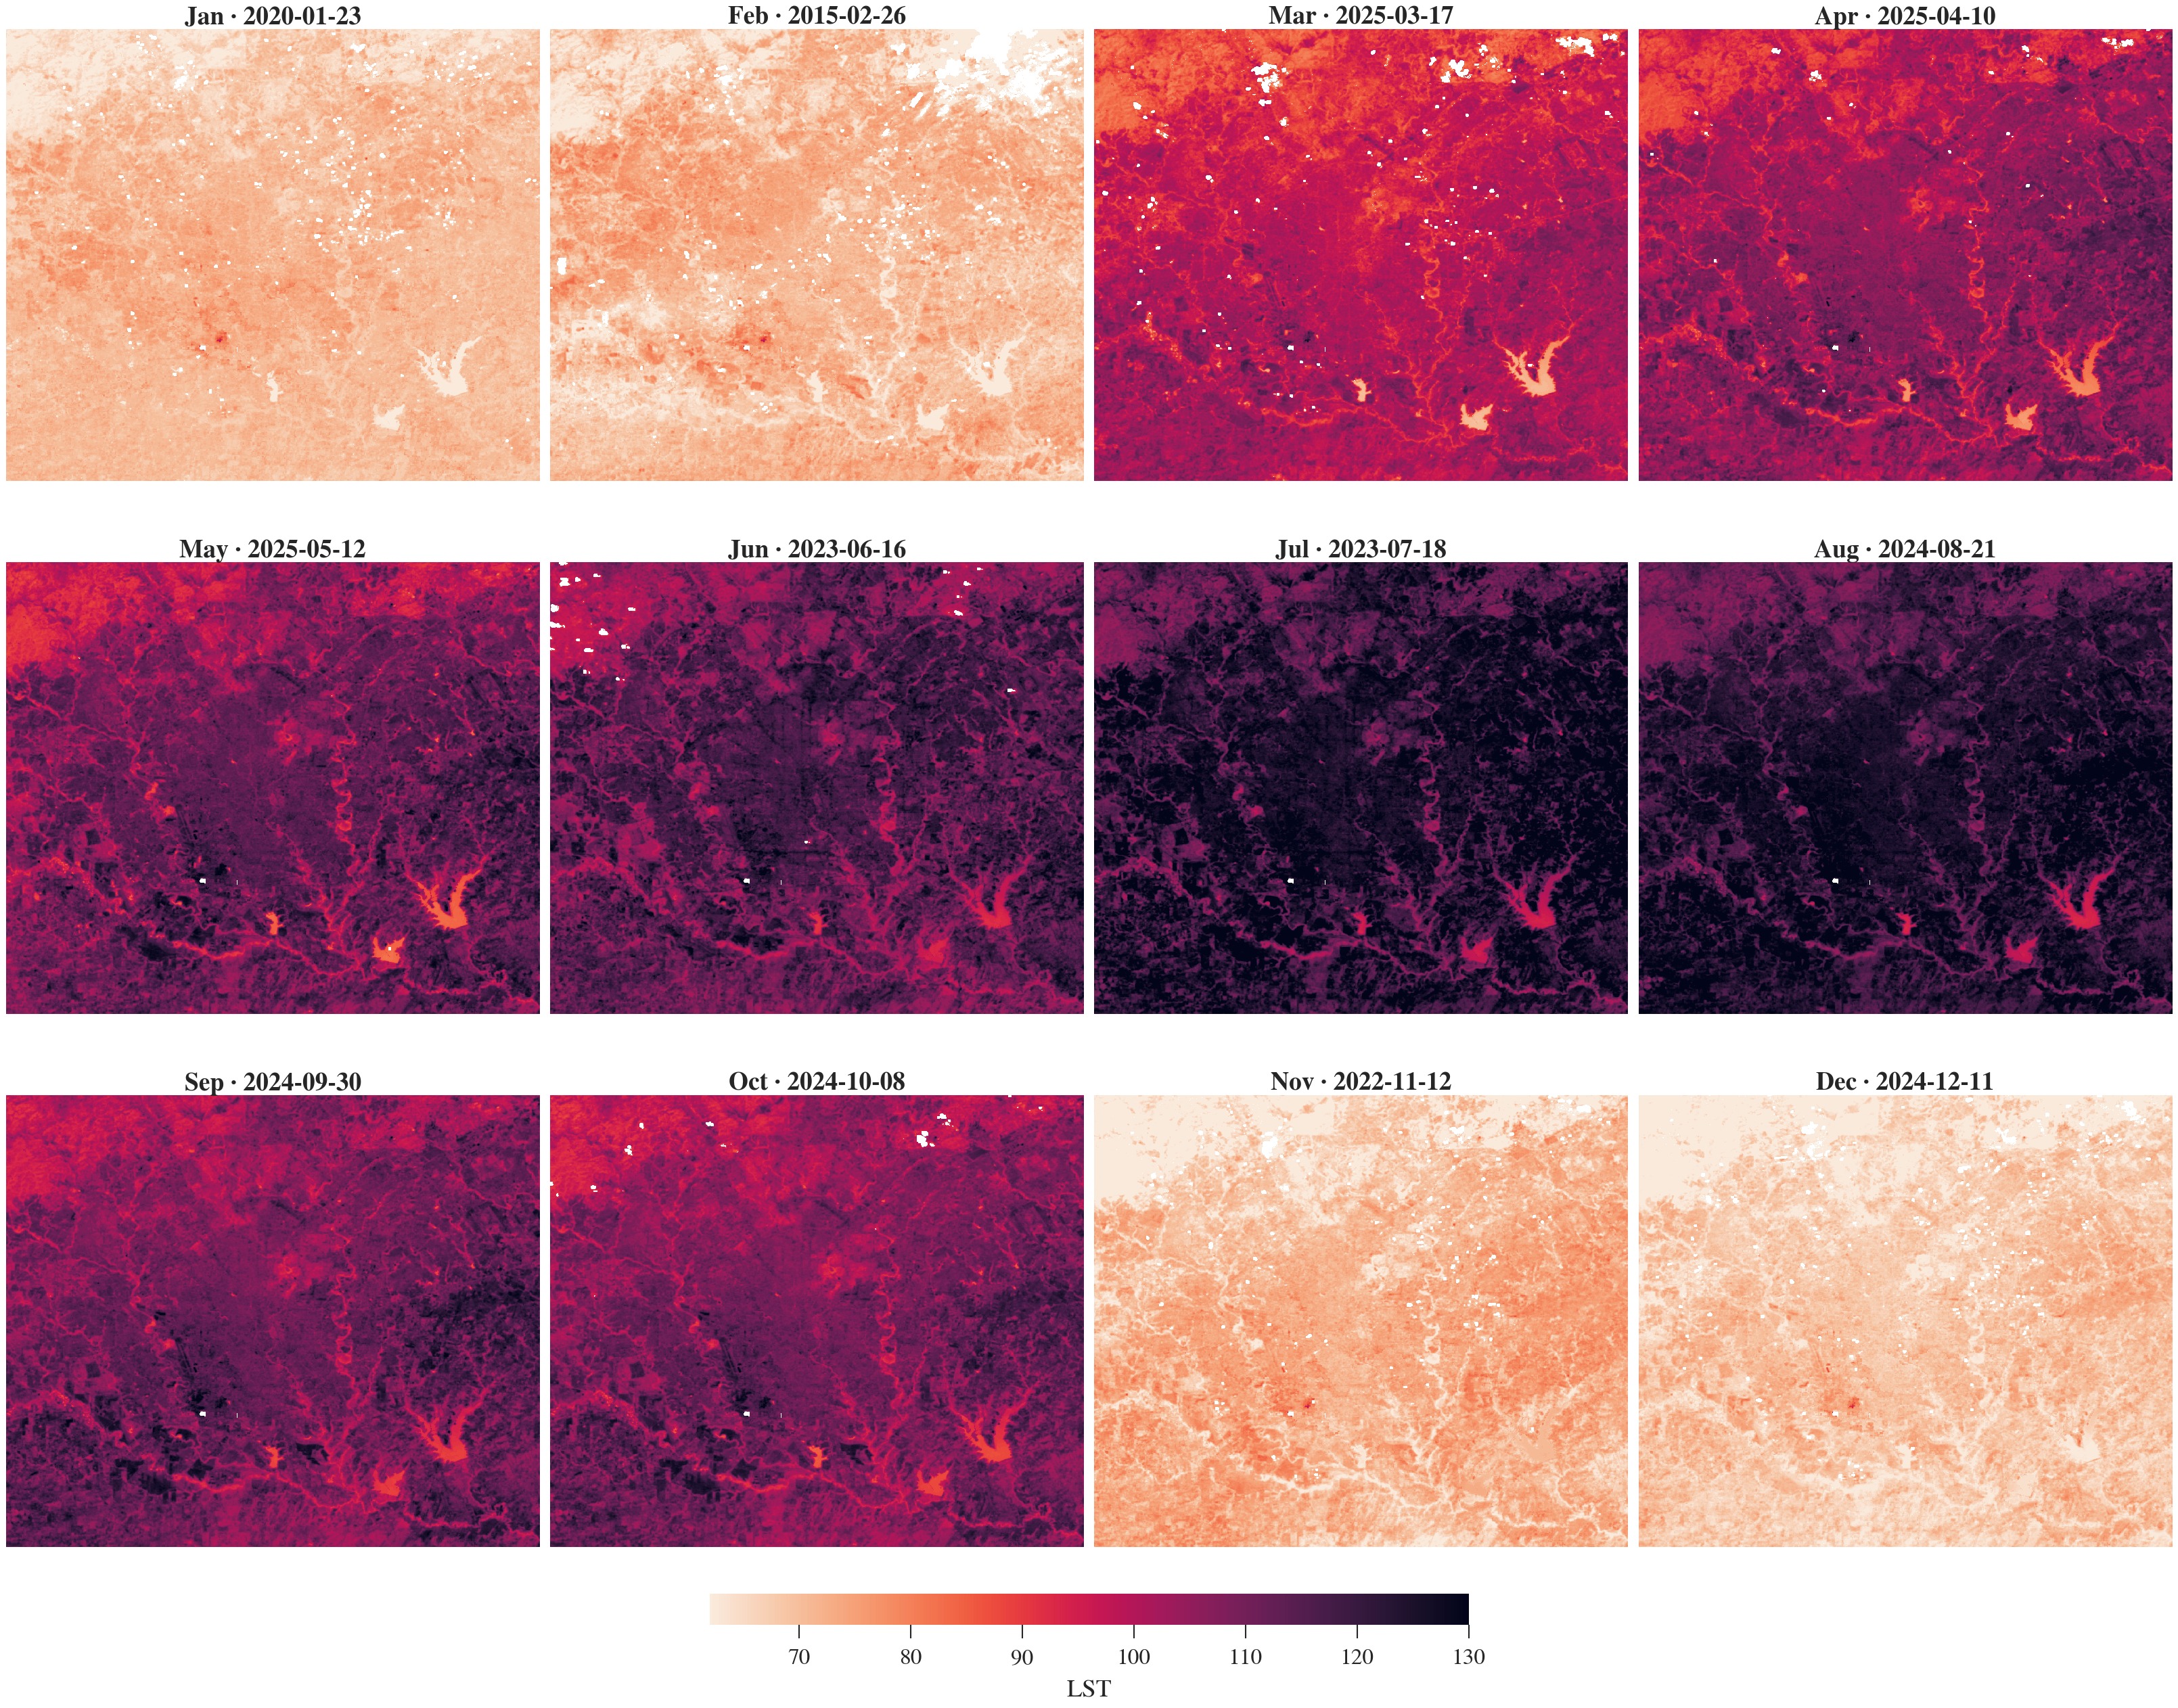
Monthly LST cycle over San Antonio, TX. For each calendar month we select the highest-coverage Landsat scene (preferring recent years, falling back when no clean scene exists), and render all twelve panels on a single colorbar. Two signals are visible at 30 m: a strong seasonal cycle (light colors in winter, dark heat in mid-summer).
Heat Trend Analysis
The benchmark ships per-city annual-mean LST histories, so the released Zarr stores support trend and attribution analysis.
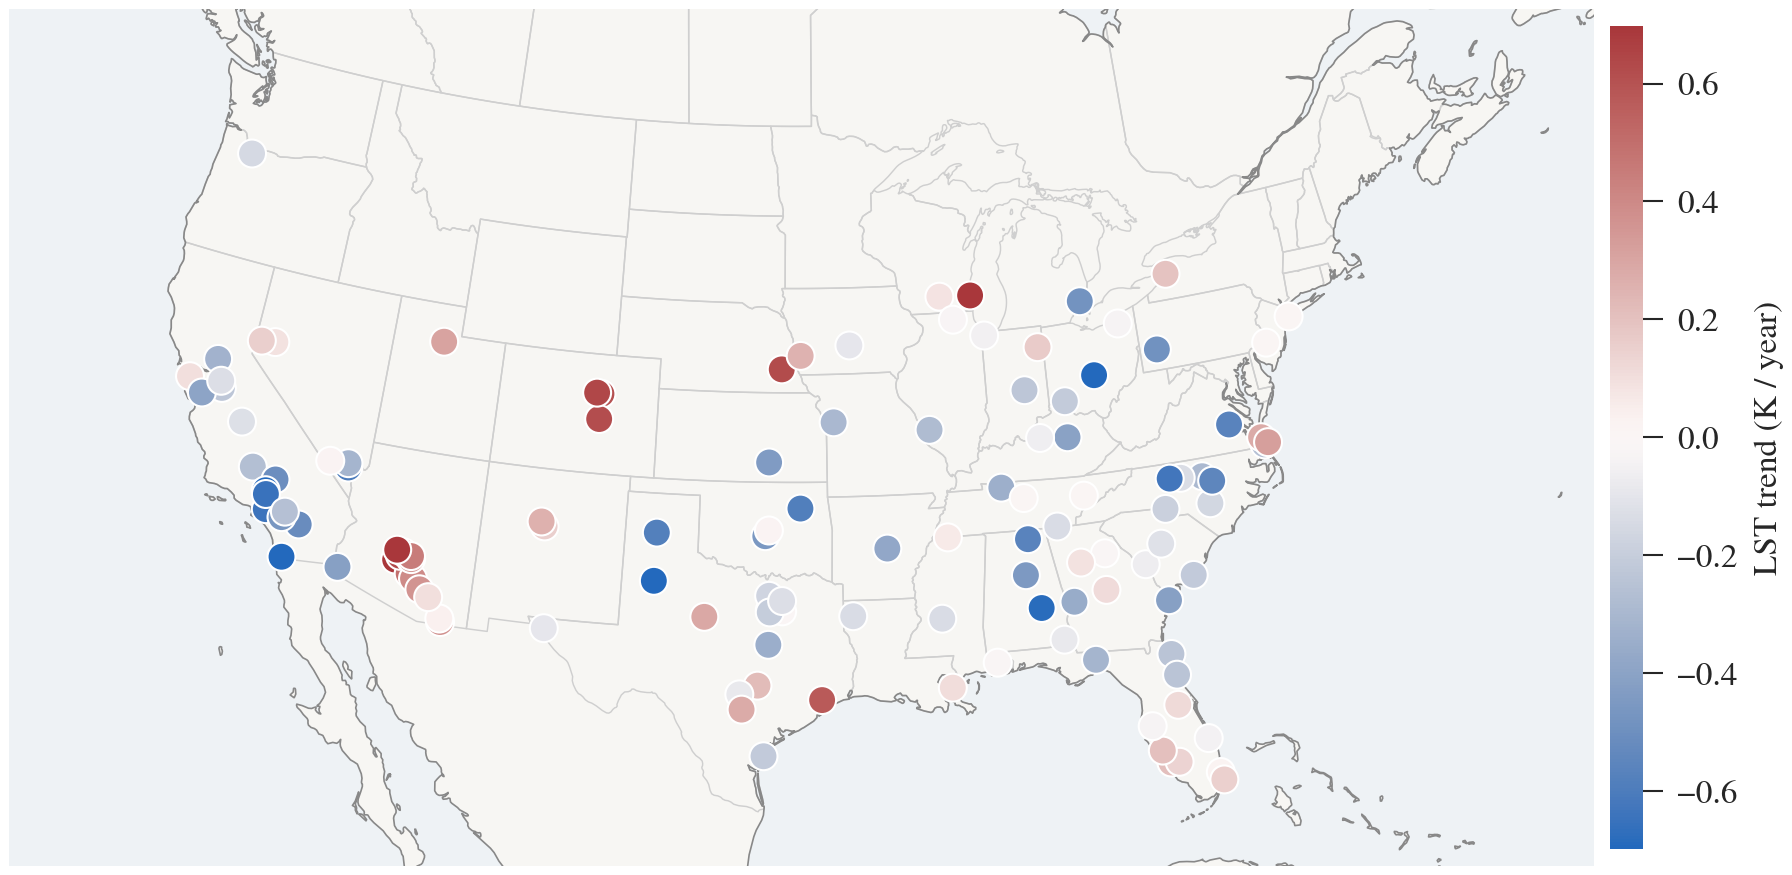
Per-city LST trend across HeatCast: the OLS slope of annual-mean LST against year (K/year), for every city with at least six years of QC-passed acquisitions. Red cities are warming, blue cities are cooling over the 2013–2025 window.
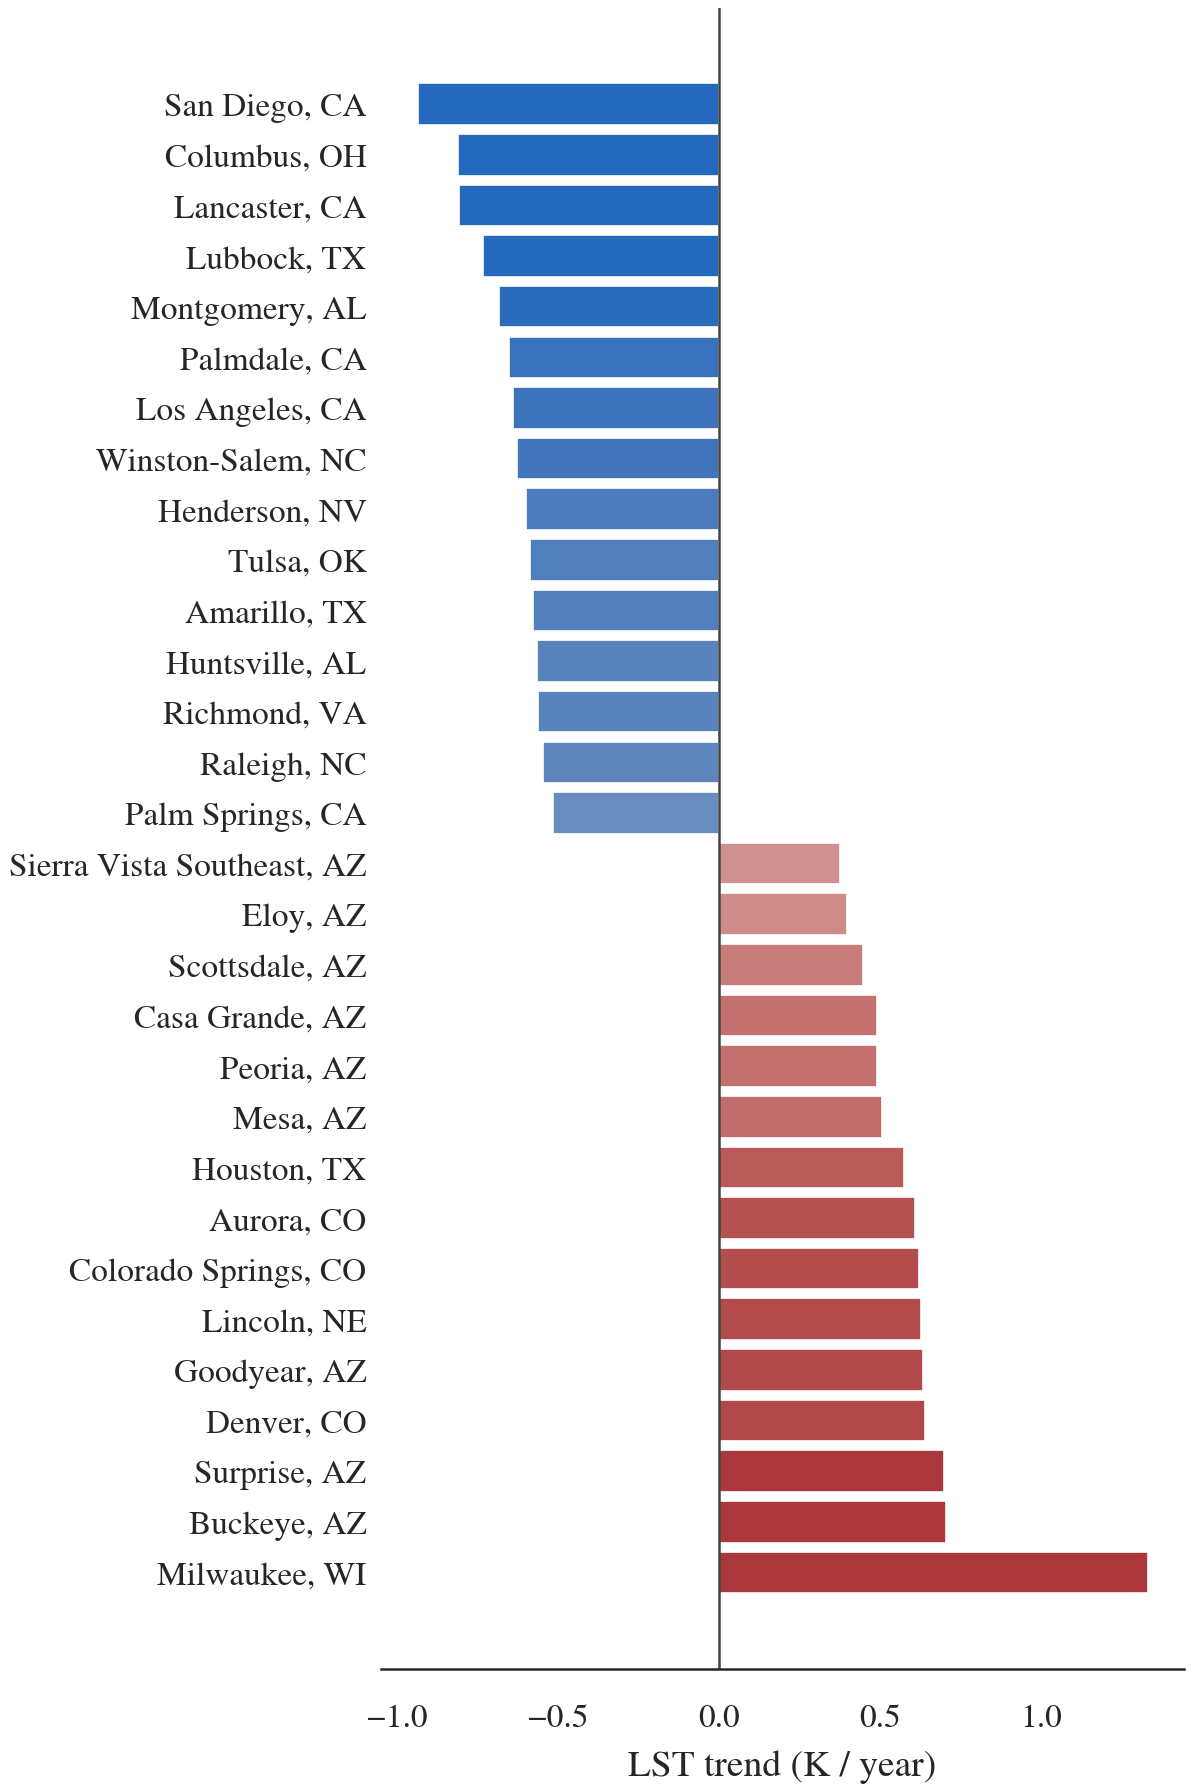
The fifteen most strongly cooling (blue) and fifteen most strongly warming (red) cities, ranked by their annual-mean LST slope.
Loading HeatCast
Load HeatCast with the released LandsatSequenceDataset: temporal split, 12-month input window, 1-month forecast horizon, and a DataLoader ready for training.
from torch.utils.data import DataLoader
from dataset import LandsatSequenceDataset

train_ds = LandsatSequenceDataset(
    dataset_root="./Data/HeatCast",
    cluster="all",
    input_sequence_length=12,
    output_sequence_length=1,
    split="train",
    train_years=list(range(2013, 2022)),
    val_years=[2022, 2023],
    test_years=[2024, 2025],
    max_input_nodata_pct=0.60,
)

loader = DataLoader(train_ds, batch_size=32,
                    shuffle=True, num_workers=8,
                    pin_memory=True)

x, y = next(iter(loader))
# x: (B, 12, 9, 128, 128) -- 9 channels
# y: (B, 1, 1, 128, 128)  -- next-month LST
Installation
Requirements
- Python 3.8+
- PyTorch 2.0+
- CUDA 11.8+ (for GPU training)
Setup
git clone https://github.com/JesseGuerrero/HeatCast.git
cd HeatCast

python -m venv venv
source venv/bin/activate  # Linux/Mac
# or: venv\Scripts\activate  # Windows

pip install torch pytorch-lightning rasterio numpy pandas wandb tqdm scikit-learn matplotlib earthformer
Quick Start
1. Download Dataset
huggingface-cli download JesseGuerreroML/HeatCast --repo-type dataset --local-dir ./Data/HeatCast
2. Setup Data Cache
python setup_data.py \
    --dataset_root "./Data/HeatCast" \
    --cluster "all" \
    --input_length 12 \
    --output_length 1 \
    --train_years 2013 2014 2015 2016 2017 2018 2019 2020 2021 \
    --val_years 2022 2023 \
    --test_years 2024 2025
3. Train Model
python train_with_cache.py \
    --dataset_root "./Data/HeatCast" \
    --cluster "all" \
    --input_length 12 \
    --output_length 1 \
    --model_size "earthnet" \
    --batch_size 32 \
    --max_epochs 200 \
    --learning_rate 0.0001 \
    --train_years 2013 2014 2015 2016 2017 2018 2019 2020 2021 \
    --val_years 2022 2023 \
    --test_years 2024 2025 \
    --gpus 2
Model Architectures
| Model | Description |
|---|---|
earthnet |
Earthformer (CuboidTransformer) - recommended |
lstm |
CNN+LSTM baseline (DMVSTNet) |
tiny / small / medium / large |
Transformer variants at different scales |
Training with Land Cover Clusters
# Cluster 1: Dense urban (LCZ 1-3)
python train_with_cache.py --cluster "1" --model_size "earthnet"

# Cluster 2: Suburban (LCZ 4-6)
python train_with_cache.py --cluster "2" --model_size "earthnet"

# All data
python train_with_cache.py --cluster "all" --model_size "earthnet"
Channel Ablation
# RGB only (remove spectral indices, DEM, and historical LST)
python setup_data.py --remove_channels DEM ndvi ndwi ndbi albedo LST
python train_with_cache.py --remove_channels DEM ndvi ndwi ndbi albedo LST
Benchmark Results
Test-set RMSE on the temporal split.
Performance by LCZ Cluster
| Cluster | LCZ | Description | CNN+LSTM | Earthformer |
|---|---|---|---|---|
| All LCZs | 1-17 | All land types | 10.42 K | 7.74 K |
| Compact urban | 1-3 | Dense buildings, sparse green space | 8.62 K | 12.68 K |
| Open urban | 4-6 | Less dense buildings, more green space | 10.82 K | 8.41 K |
| Other urban | 7-10 | Remaining urban classes | 8.01 K | 6.99 K |
| Natural | 11-17 | Natural landscapes | 9.78 K | 6.58 K |
Feature-Set Ablation
| Input Configuration | CNN+LSTM | Earthformer |
|---|---|---|
| All channels (default) | 10.42 K | 7.74 K |
| LST only | 11.09 K | 8.15 K |
| Spectral (no LST) | 12.47 K | 7.72 K |
| RGB only | 14.82 K | 8.68 K |
For Earthformer, removing historical LST and keeping only the spectral channels yields essentially the same RMSE (7.72 K vs. 7.74 K), indicating that Earthformer gains no measurable accuracy from past LST once the spectral channels are present.
Web Application
The interactive visualization demonstrates LST predictions for downtown San Antonio, TX using a 3D ArcGIS map with:
- Monthly LST overlay with time slider (2025-2026 predictions)
- Pre-rendered PNG map tiles at zoom levels 14-17
- Chat interface powered by an LLM for planning guidance
Run locally:
cd web-app
conda env create -f environment.yml
conda activate earthformer
python _inference_city.py   # generate tiles and temperature grids
python -m http.server 3000  # preview at http://localhost:3000
Repository Structure
HeatCast/
├── dataset.py              # PyTorch dataset with interpolation and caching
├── model.py                # Earthformer and CNN+LSTM (DMVSTNet) models
├── setup_data.py           # Data preprocessing and sequence cache builder
├── train_with_cache.py     # Training script with WandB logging
├── stac_scrapper.ipynb     # Landsat STAC data collection
├── preprocess.ipynb        # Data preprocessing notebook
├── main.ipynb              # Main experiment notebook
├── CONUS_LCZ.tif           # CONUS-wide Local Climate Zone raster
├── scripts/                # Shell scripts for training and ablation
├── test/                   # Test and evaluation scripts
├── analysis/               # Dataset analysis and visualization
│   └── out/                # Distribution plots and statistics
├── web-app/                # Interactive LST visualization app
│   ├── index.html          # ArcGIS 3D map with chat interface
│   ├── _inference_city.py  # City-wide inference pipeline
│   ├── model.py            # Model loading for inference
│   └── model_baseline.ckpt # Pre-trained Earthformer checkpoint (Git LFS)
└── Data/
    └── City_Shapes/        # City boundary shapefiles
Acknowledgements
- Secure AI Autonomy Laboratory (SAAL) at the University of Texas at San Antonio
- UTSA High Performance Computing Platform
- Data: Landsat 8/9 (USGS/NASA), CONUS LCZ, Urban Footprints (Esri)
License
MIT
- Downloads last month
- 135